Infographics

Think of an infographic as a visual graph that packs a punch. Our collection will give you a visual snapshot into some of the hottest topics affecting teens today. Each infographic was created by a different non-profit but we’ve brought them here to show you the best of them.
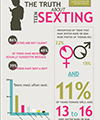 Before 2008 the word sexting didn't even exist. Today it is a common activity of many texting teenagers.
CLICK HERE for the full infographic.
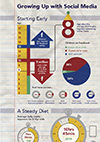
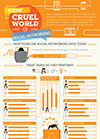 Teenagers' understanding of community has greatly changed because of social media. The way they communicate and relate to one another has been changed forever. For better or worse social media is here to stay.
CLICK HERE for the full infographic.
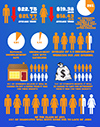 This generation of college graduates will be launching into their careers with a staggering amount of debt. Take a look at how this debt effects their next steps in life.
CLICK HERE for the full infographic.
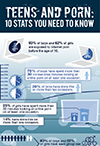 90% of 8-18 year olds have view pornography on the internet. It is the most common addition among teen boys and has altered this generation's view of dating, relationships, and their own sexuality.
CLICK HERE for the full infographic.
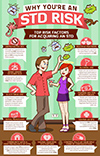 More than 25% of all sexually active teenager contract an STD each year. Most parents and teens don't even fully understand the dangers.
CLICK HERE for the full infographic.
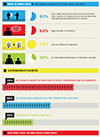
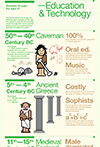 Technology has greatly changed the way and the places students learn. From stone tablets to computer tablets see how students lives have shifted through technology.
CLICK HERE for the full infographic.
 Technology has greatly changed the way and the places students learn. From stone tablets to computer tablets see how students lives have shifted through technology.
CLICK HERE for the full infographic.
 The typical college student will spend between $3000-6000 on textbooks during their college experience. No wonder more and more school are opting for cheaper (and much lighter) textbooks.
CLICK HERE for the full infographic.
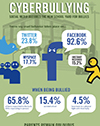 Cyberbullying is defined as harassing or demeaning someone by means of technology. It is now the most common form of bullying among teenagers with more than 1 in 3 becoming victims.
CLICK HERE for the full infographic.
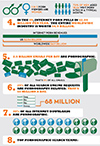 More than 33% of all files downloaded off the internet are pornography related. Who would have known that Utah has more people than any other state that subscribe to porn sites?
CLICK HERE for the full infographic.
 Children who cheat become teenagers who cheat who become adults who cheat. Unfortunately, we are raising a generation of cheaters.
CLICK HERE for the full infographic.
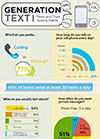
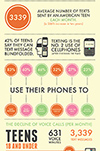 Ever wondered how many text messages the average teenager sends each month? Can you guess how often they are on their phone each day?
CLICK HERE for the full infographic.
 Did you know that more than half of all 11 and 12 year olds are on Facebook or Instagram. This generation has never know a world without social media.
CLICK HERE for the full infographic.